Get the right info to make the right calls




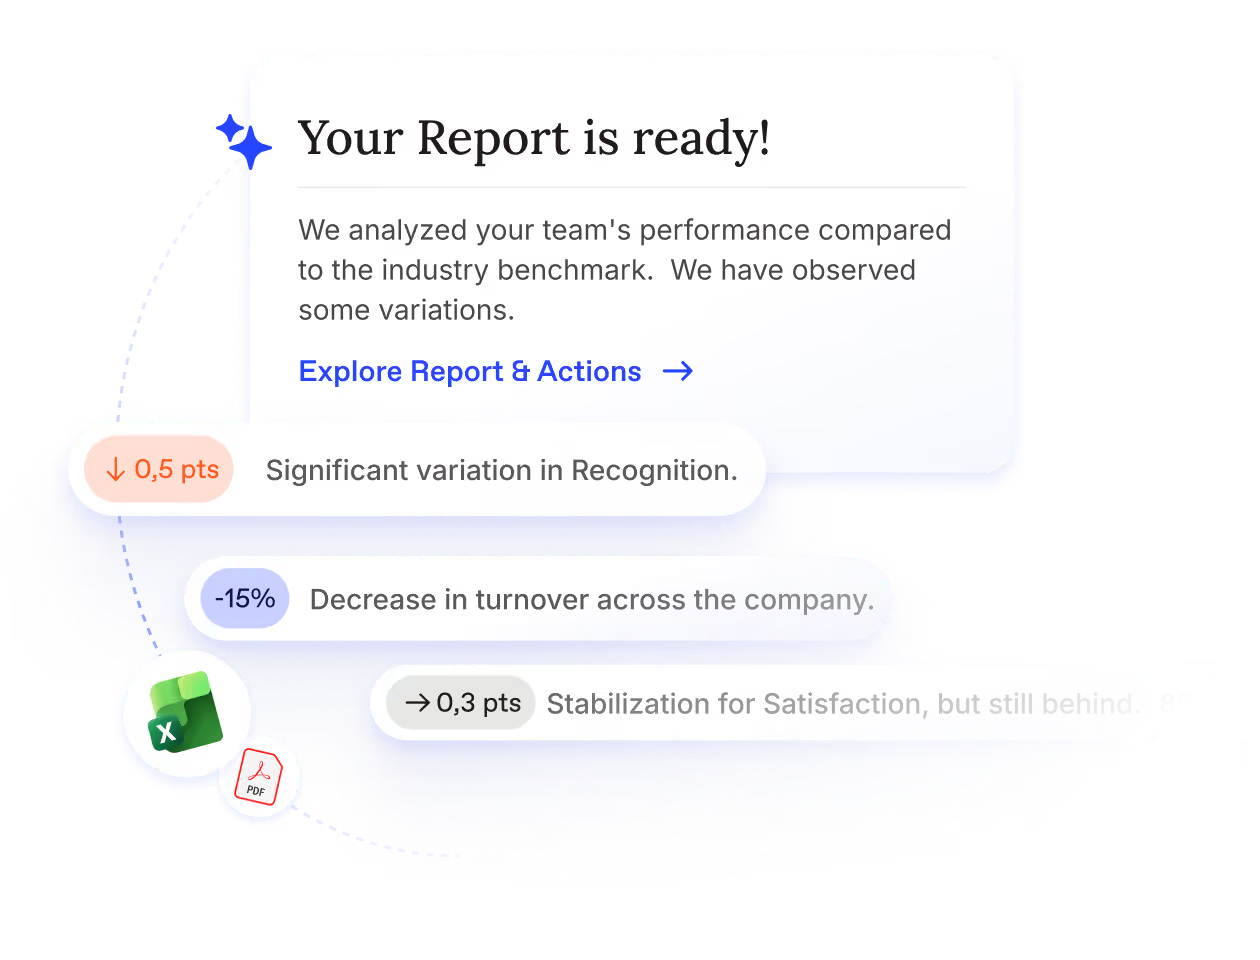
Workleap reports, explains, and pinpoints
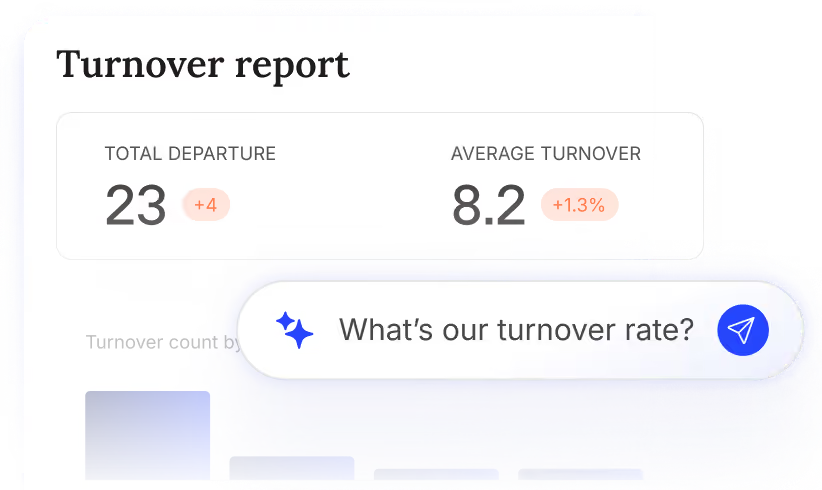
Answer every questions
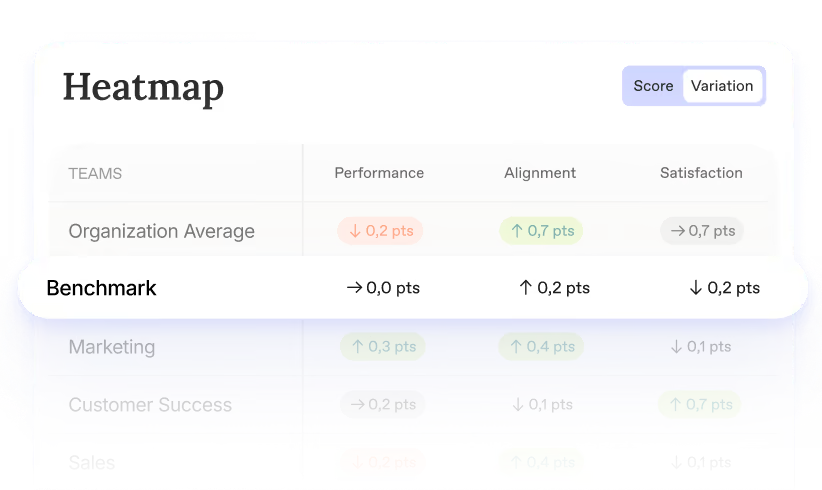
Know what the numbers mean
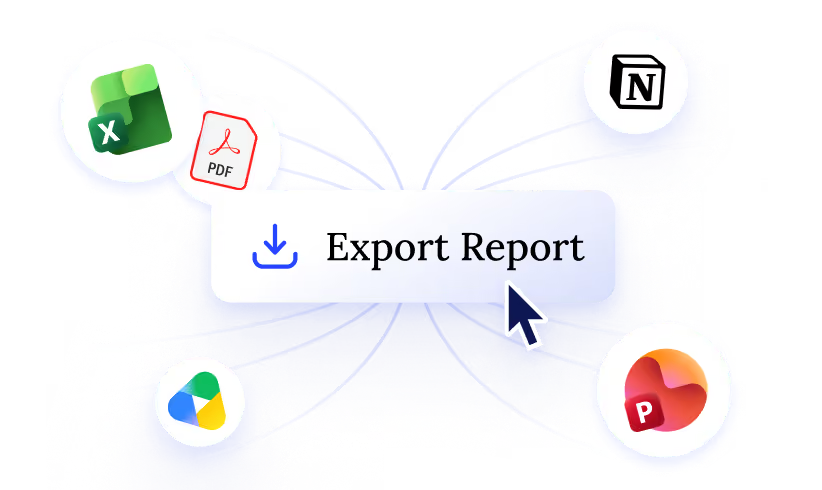
Share in one step
Get your own personal analyst
Before Workleap
- Pulling data together eats hours of HR's time.
- Patterns stay buried in a mountain of data.
- Nobody has the time to do real deep dives.
- Tracking trends is as time consuming as reporting.
- Every report gets assembled from scratch.

After Workleap
- Ready-made reports cover HR needs in an instant.
- Workleap finds hidden insights you can act on.
- Get granular reports on any niche question.
- Follow trends as they appear and share them easily.
- Every report builds on previous learnings.
Everything you need to know about your business.
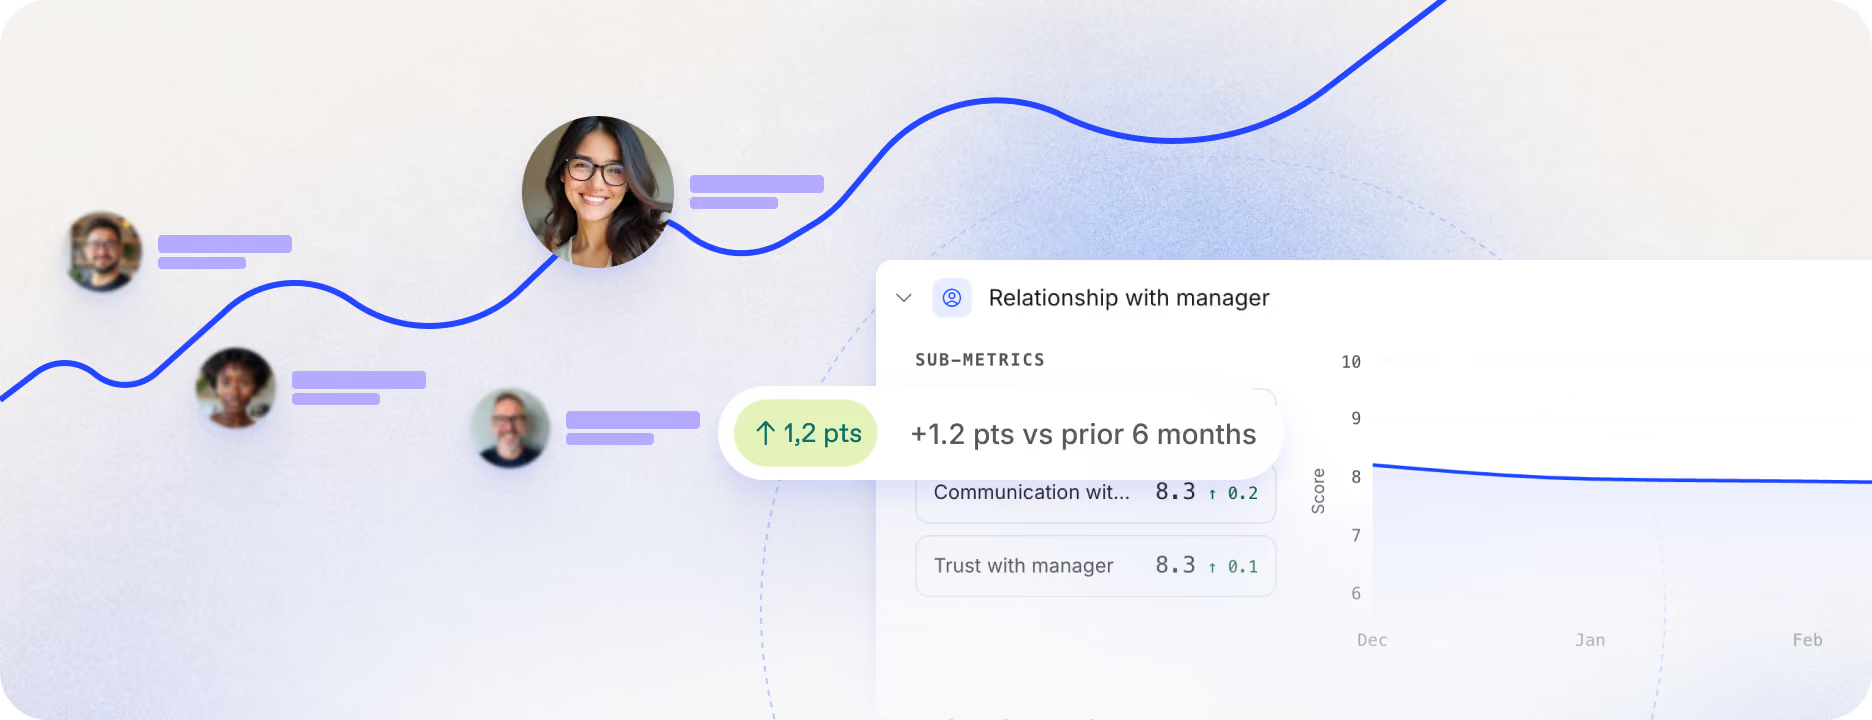
Engagement reports
- Engagement: overall score, employee Net Promoter Score (eNPS), participation, and results for every survey question.
- Feedback: volume, sentiment, manager reply rates, and the topics on the rise.
- Manager impact: a score for each manager based on their 1:1s, feedback, recognition, goals, and team results, plus the hours Workleap saves them.
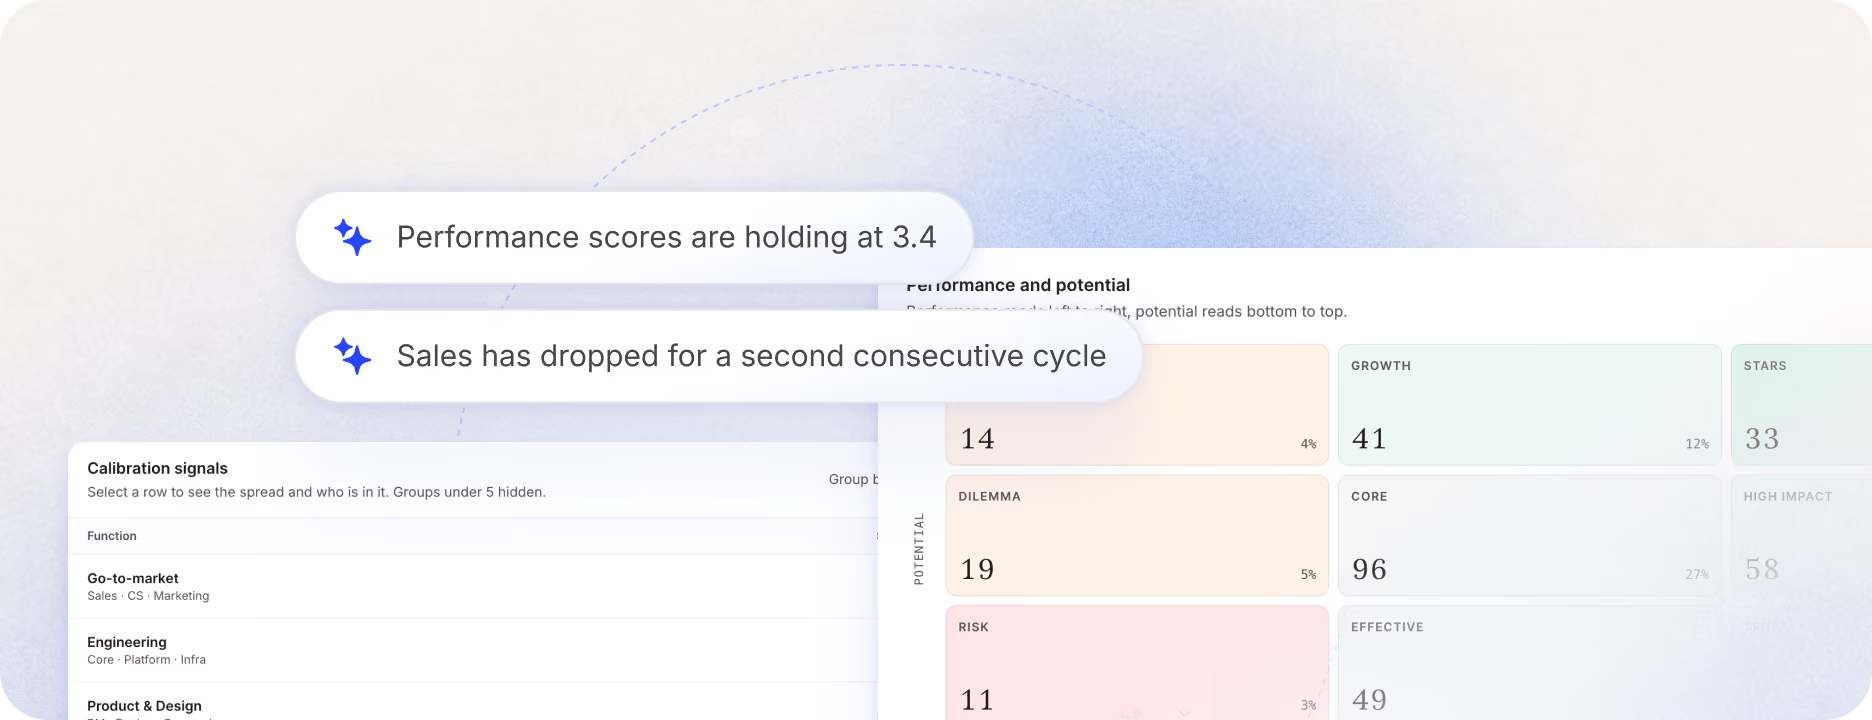
Performance reports
- Performance reviews: how ratings spread across the organization, review completion, and calibration.
- Goals: each goal's status, progress, and the owner's latest update.
- 1:1s: completion, coverage, agenda use, and time between 1:1s for every manager.
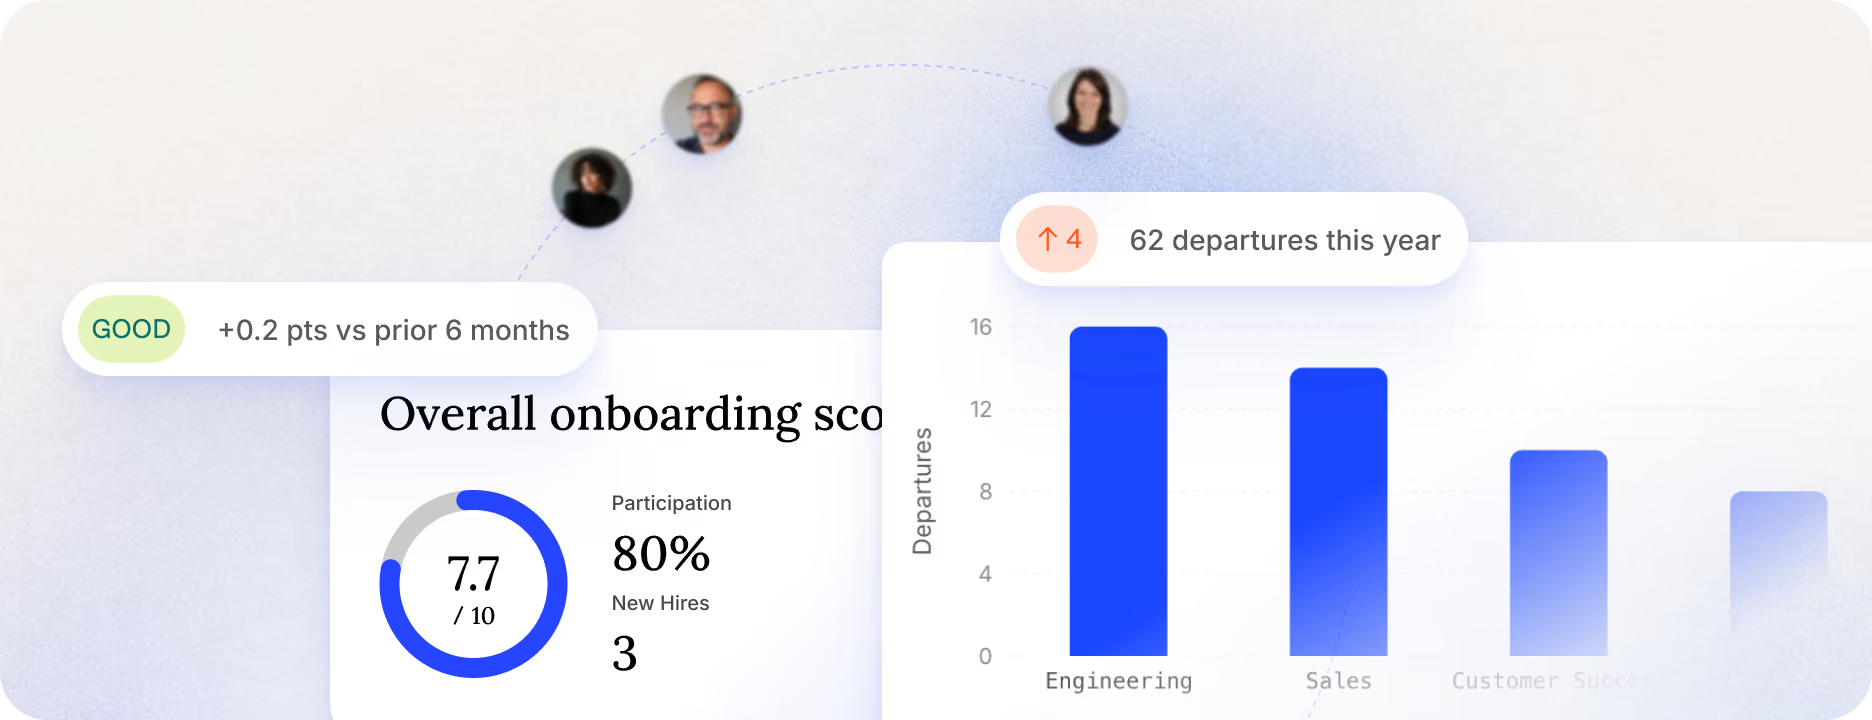
Lifecycle reports
- Onboarding: new-hire scores on role and expectations, onboarding experience, and culture and connection.
- Retention: exit survey results, turnover by department, and how long people stay before they leave.
- DEIB: separate scores for diversity, equity, inclusion, and belonging.
Recognition reports
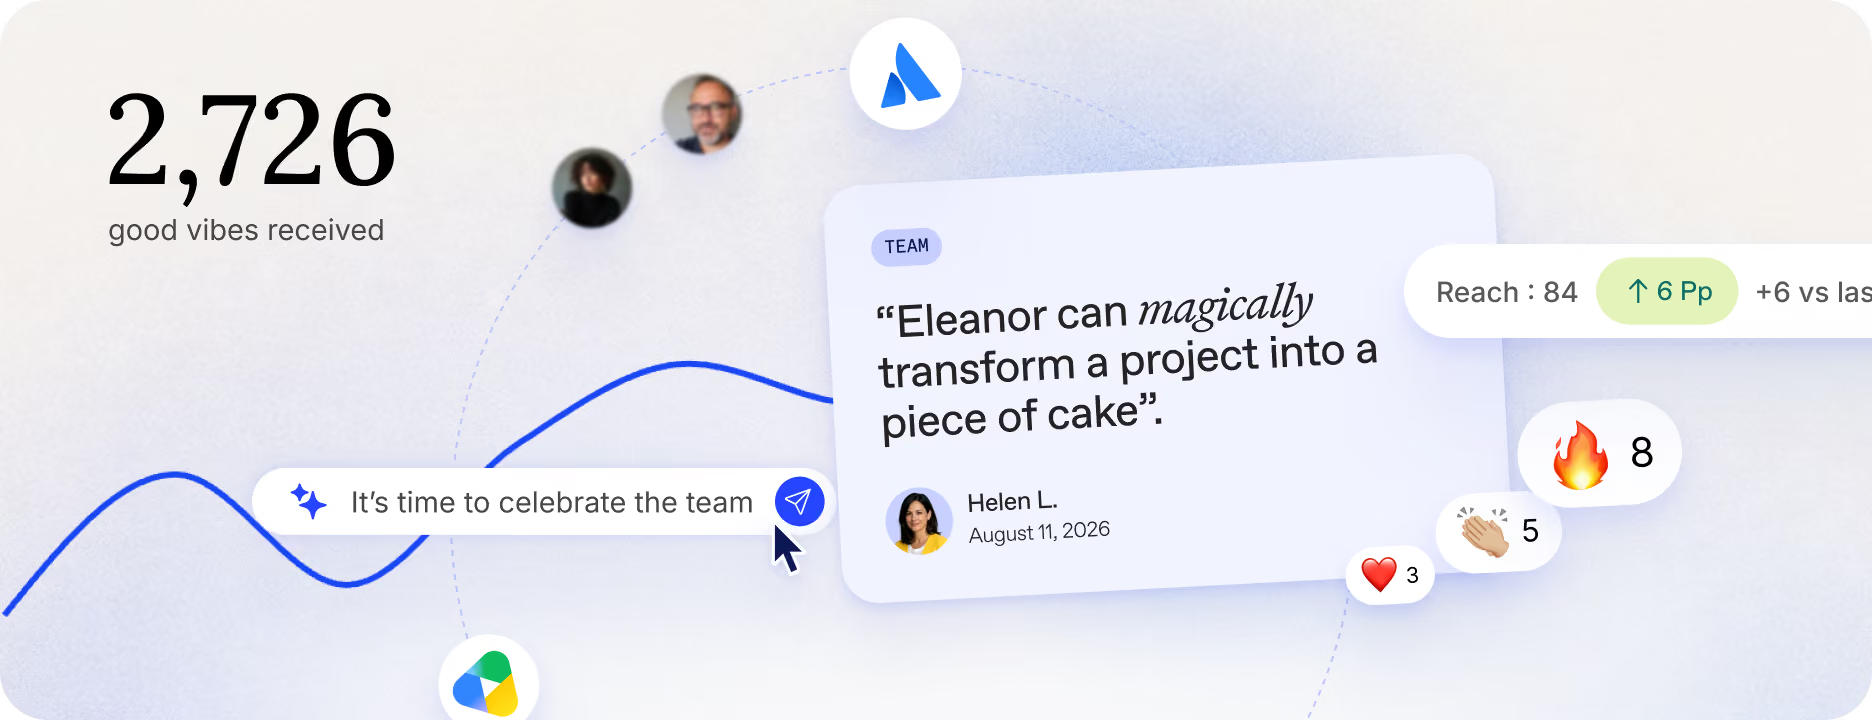
- Good Vibes: the recognition cards people send each other, counted over time.
- Reach: how many people receive recognition, and how many send it.
- Leaderboard and themes: who gets recognized most, and what for.
Custom reports
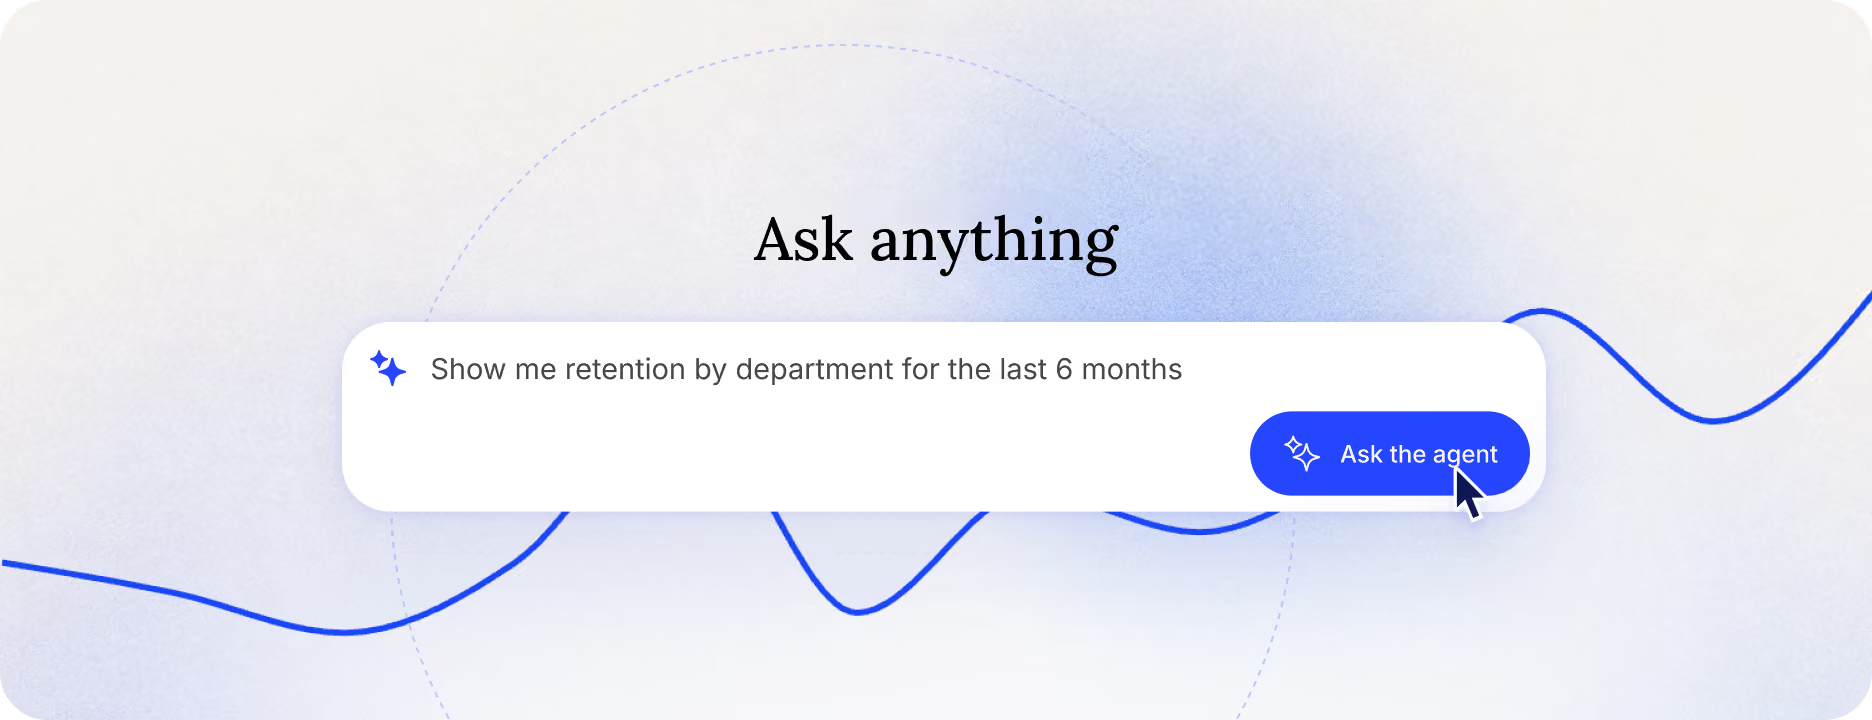
- Describe the report you need in plain language. Workleap picks the data and the chart.
- Start from suggestions like engagement by team or sentiment by tenure band.
- Pin the reports you check often, and go back to recent ones.
Compensation reports
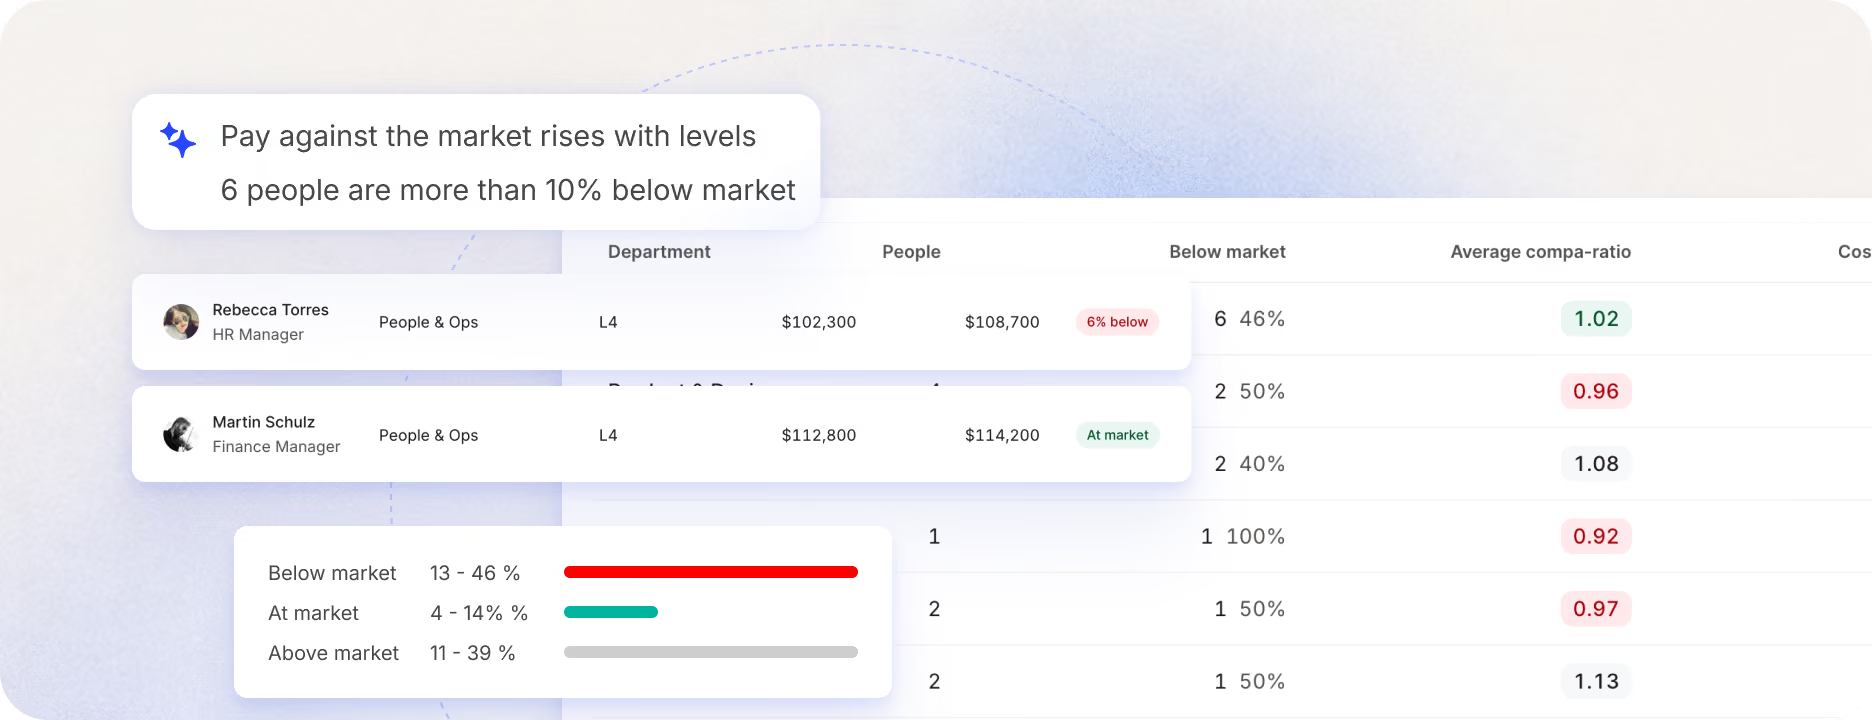
- Pay against the market: the share of people paid below, at, or above market, and the average compa-ratio.
- Cost to bring people to market: the total, how many people it covers, and its share of base payroll.
- By department and by person: each department's position, and each person's base pay next to the benchmark for their level.
Cover people analytics, from A to Z.


We play nice with the tools you love
We connect to the tools you use, from your HRIS to your favorite LLM. Workleap is always where your managers are.
Explore all integrationsGood management today runs on luck. It shouldn't


Let’s turn your managers into leaders
Goals
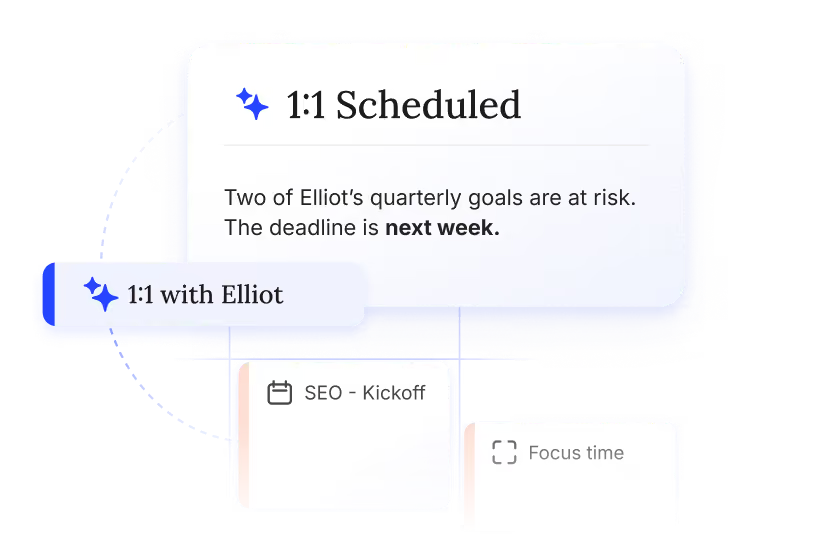
Meetings & 1:1s
Performance reviews
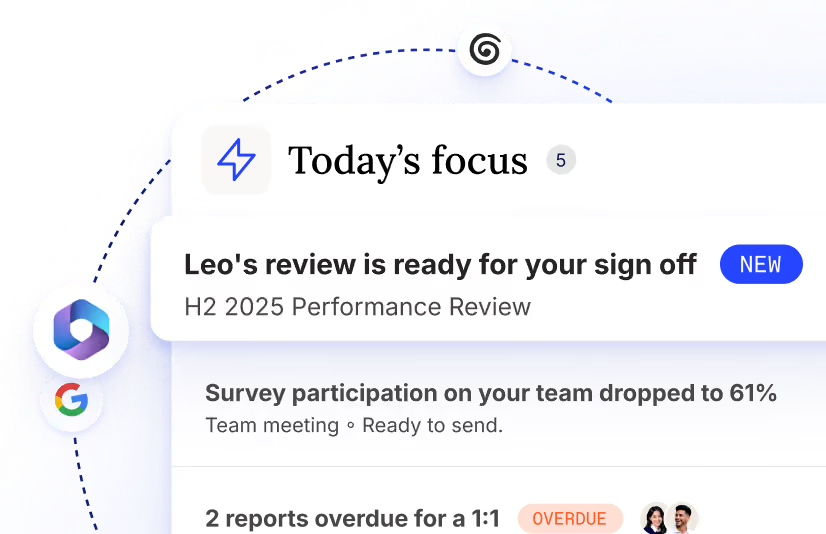
Briefing
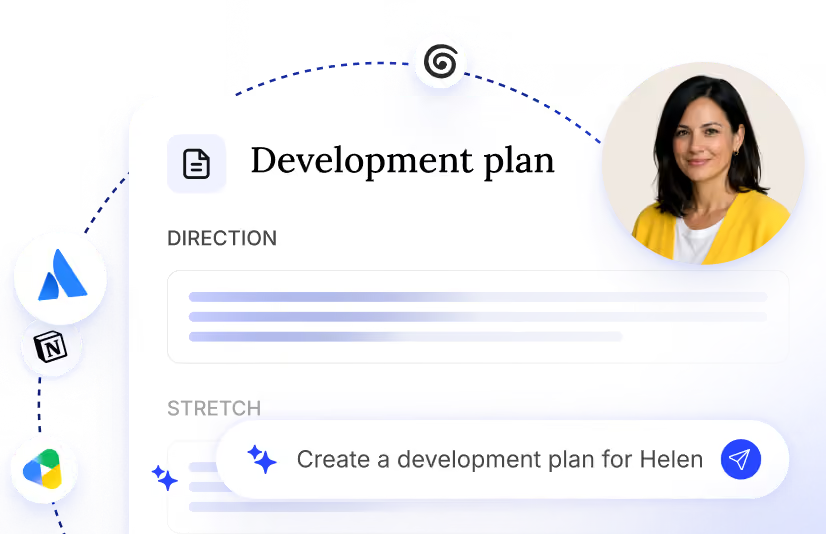
Action plans
Good Vibes
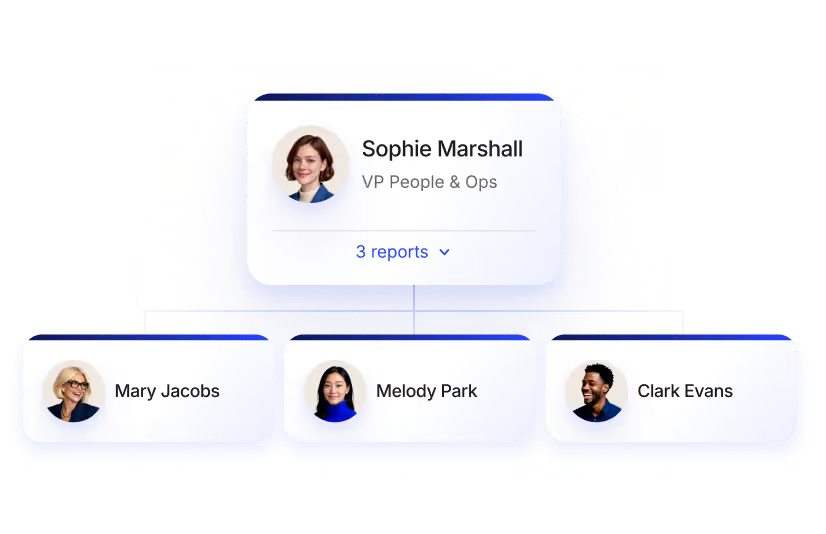
People & Org
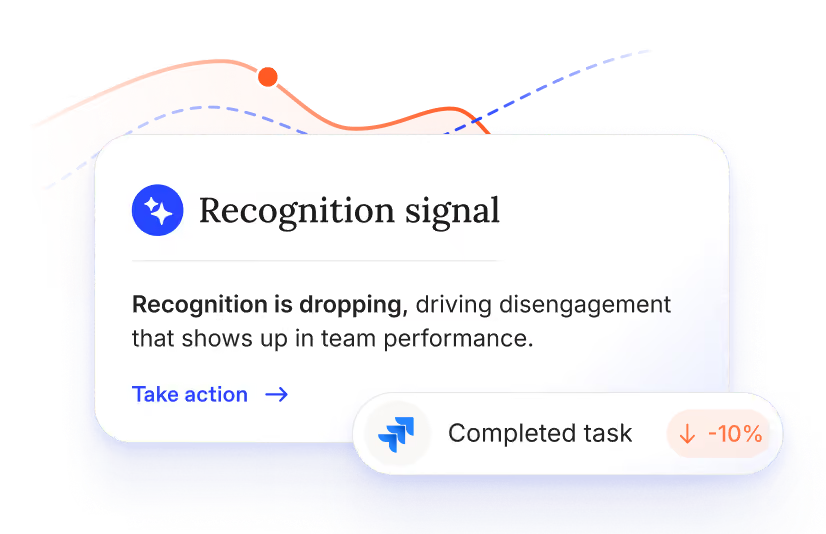
Team health & feedback
Stop hoping for *better managers*
Everything you need to know about Analytics
People analytics means using data about your workforce, like engagement, performance, goals, and turnover, to understand what's happening on your teams and decide what to do next. Workleap gives you ready-made reports on all of it and builds any other report you ask for.
Ask about any person, any team, or the whole organization, from how a single manager's team is doing to engagement trends across the company. Describe what you need in plain language, and Workleap builds the report.
Reports on engagement, feedback, and manager impact; performance reviews, goals, and 1:1s; onboarding, retention, and DEIB; and recognition. Each one covers the whole company or a single team.
No. The reports are ready when you open them, and you ask for anything else in plain language. There's no dashboard to build and no data to slice by hand.
The data already in Workleap: engagement surveys, feedback, performance reviews, goals, 1:1s, onboarding and exit surveys, DEIB surveys, and recognition.
A dashboard shows the numbers and leaves the reading to you. Every Workleap report opens on a short summary of what changed and what to look at first, and you can ask Workleap to dig deeper into any result.
Workleap compares your engagement results with benchmarks from thousands of companies, built on 15 years of engagement data. You see where each score stands, and how it has moved since the last period.
Access to reports follows the permissions your organization sets.
Analytics isn't sold on its own. It's one of the capabilities inside Workleap, alongside Performance Reviews, Team Health & Feedback, Goals, Meetings & 1:1s, and more, all reporting from the same data. Book a demo to see how it fits your plan.